Visibility Plot
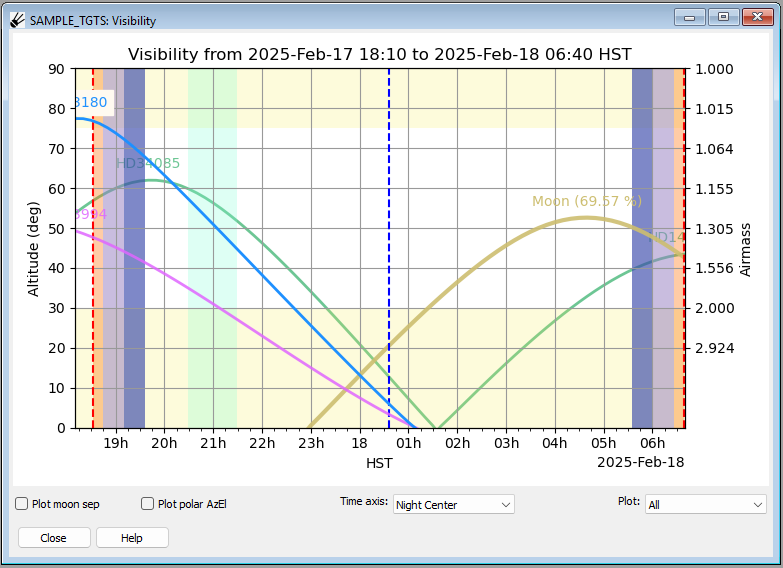
This window contains a display which shows the altitude over time of selected targets in your target list.
Note
This window will be blank if there are no targets selected.
Highlighted regions
The yellow regions at the top and bottom are the warning areas. In those regions observations are difficult due to high airmass or very high elevation. The dashed red vertical lines are the site sunset and sunrise times. The vertical orange region demarcates the time of Civil Twilight, the vertical lavender region demarcates the time of Nautical Twilight, and the vertical blue region demarcates the time of Astronomical Twilight. The green region marks the next hour from the current time.
Setting time interval
To change the plotted time interval, press the button next to “Centered on:” to open a drop down menu. Three options are available, Night Center, Day Center, and Current. “Night Center” will center the time axis on the middle of the night, which can be found in the Polar Sky window. The time axis will extend from a little before sunset to a little after sunrise. “Day Center” will center the time axis on the middle of the day, and the time axis will extend from sunrise to sunset. “Current” will set the time axis to extend from about -2 to +7 hours, and will automatically adjust as time passes.
Checking moon separation
The visibility window can display the moon-object separation by pressing the checkbox next to “Plot moon sep” at the bottom left corner of the window. Selecting this option will display the separation in degrees at every hour while the object is above the horizon.
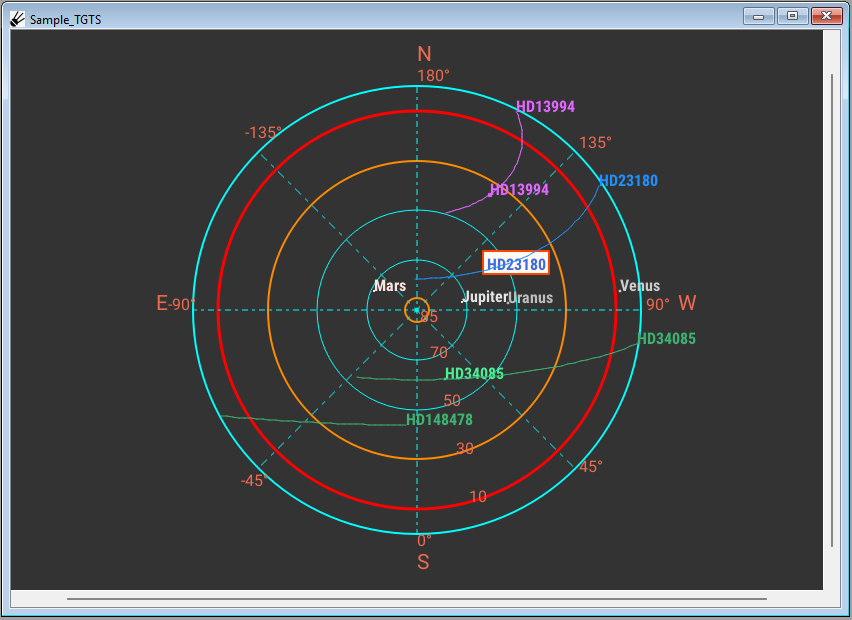
Plotting target paths
The paths the targets will take across the sky can be plotted on the Targets channel by pressing the checkbox next to “Plot polar AzEl”. When selected, the path of the target across the sky within the time range of the visibility plot will be shown.
Plot Options
The drop down menu by “Plot:” controls which targets are plotted on the visibility plot. Selecting “All” will show all of the targets, selecting “Tagged+Selected” will show all of the targets which have been tagged or are selected, and selecting “Selected” will show only the target which is selected.
Selected targets will be shown in blue, any tagged targets will be shown in magenta, and all other targets will be shown in green.